Clear KPI logic
Define the metrics, filters and update frequency before building charts.

We build custom high-performance websites & apps with 24/7 support.
Build dashboards that turn scattered business data into clear daily decision support for operations, sales, finance and service teams.
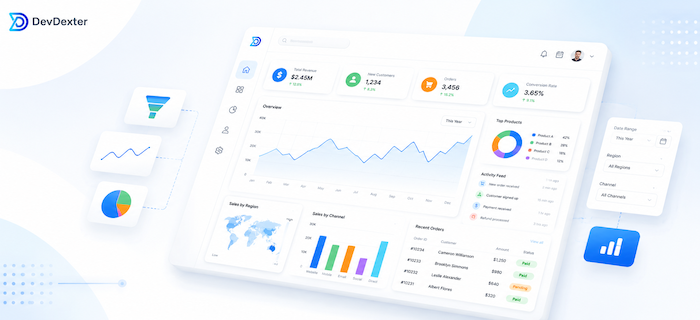
Many companies collect data but still depend on manual reports, disconnected spreadsheets and delayed status updates. DevDexter builds dashboard layers that connect data sources, clarify KPIs and make operational visibility easier to use.
Define the metrics, filters and update frequency before building charts.
Pull from internal systems, forms, CRMs, APIs or operational databases where needed.
Show trends, status, exceptions and drilldowns that support practical decisions.
Dashboard development is not only about charts. It is about giving teams a reliable decision layer when reporting is delayed, scattered or too manual to trust every day.
DevDexter helps define what each audience needs to see, where the data should come from and how dashboard views should support decisions. A dashboard may live inside a web application, connect to a custom application, or sit beside existing tools as a reporting layer.
A useful dashboard gives each role the right level of visibility: leadership sees performance, managers see bottlenecks and daily users see what needs attention.
Different teams need different dashboard layers. DevDexter can combine operational, executive and client-facing views inside one reporting structure.
High-level revenue, pipeline, delivery and operational health metrics.
Leads, sources, conversion rates, pipeline stages and follow-up activity.
Open tasks, approvals, workload, delays, handoffs and process status.
Revenue views, invoice status, payment summaries and financial filters.
Support backlog, response times, SLA status and issue categories.
Selected metrics and project visibility for customers or partners.
Track approvals, request stages, exceptions and team ownership.
Surface overdue items, unusual changes and exceptions that need attention.
Lead conversion rate, revenue by source, pipeline stage movement and follow-up activity.
Response time, support ticket backlog, SLA status and delivery status.
Open tasks, approval delays, team workload, processing time and exception count.
Invoice status, payment trends, revenue summaries and outstanding items.
Project progress, completed milestones, account activity and shared service metrics.
Period comparisons, bottleneck tracking, ownership visibility and decision notes.
Dashboards can connect with existing business systems when the data is accessible and the metric definitions are clear.
Agree on KPIs, owners, source systems and decision needs.
Plan data structure, permissions, filters and refresh behavior.
Create dashboard layouts that are readable and focused.
Connect data, reports, exports, alerts and role-based access.
Improve views after users test the dashboard with real decisions.
Dashboard cost depends on the number of data sources, views, filters and access rules. Real-time reporting, alerts and client-facing access usually add scope.
Each source needs access, mapping, cleaning and validation.
Inconsistent records may need cleanup rules before reporting is useful.
Executive, sales, finance and operations views may require different layouts.
Managers, staff and clients may need separate permissions and filtered views.
Real-time dashboards differ from scheduled syncs in complexity.
Notifications, exception tracking and AI summaries add workflow value and scope.
We clarify KPIs, owners and decisions before designing charts.
Dashboards are planned around the operations they need to improve.
Views are designed for quick scanning, filtering and daily use.
Reporting can later connect to portals, custom systems or AI automation for summaries and alerts.
Share the reports your team builds manually today, and we will help shape a practical dashboard scope.
How dashboard strategy turns raw data into action.
Related custom dashboard planning guidance.
How reporting and integrations affect scope.
Cost factors for custom dashboards and business systems.
Both. A dashboard can be a standalone reporting layer or part of a larger application, depending on data sources and workflow needs.
Yes. Dashboards can include alerts, status reminders, exception flags and automation triggers where useful.
Managers, data owners and daily users should help define metric logic, filters and decision needs before development starts.
Yes. Client-facing dashboards can show selected reports, project status, account activity or service delivery metrics with controlled access.
Yes. Dashboards can connect to databases, APIs, CRMs, forms and other systems when access and data quality are suitable.
The right KPIs depend on the team, but common examples include lead conversion, response time, open tasks, approval delays, revenue by source, workload and SLA status.
Yes. When connected to reliable data sources, dashboards can reduce repeated spreadsheet updates and make status reviews faster.
We will help organize the dashboard scope, data sources, features and next practical step.
Stay updated with DevDexter news, offers, and tech insights.
Web & App Development for the World.
© 2026 DevDexter | All Rights Reserved