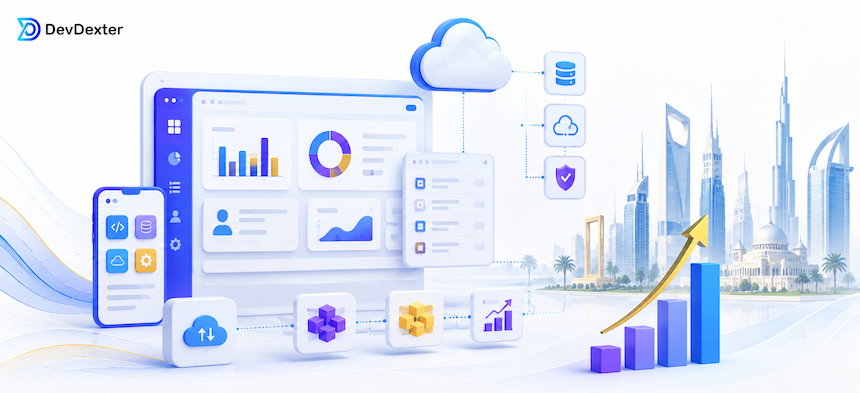

Dashboard development improves business reporting when it turns raw data into a view that helps people act. A useful dashboard is not just a set of charts. It shows the right metrics, for the right users, with clear filters, update rules and decision context.
Why manual reporting breaks down
Manual reports create delays, inconsistent numbers and version confusion. Teams spend time consolidating spreadsheets instead of using the information.
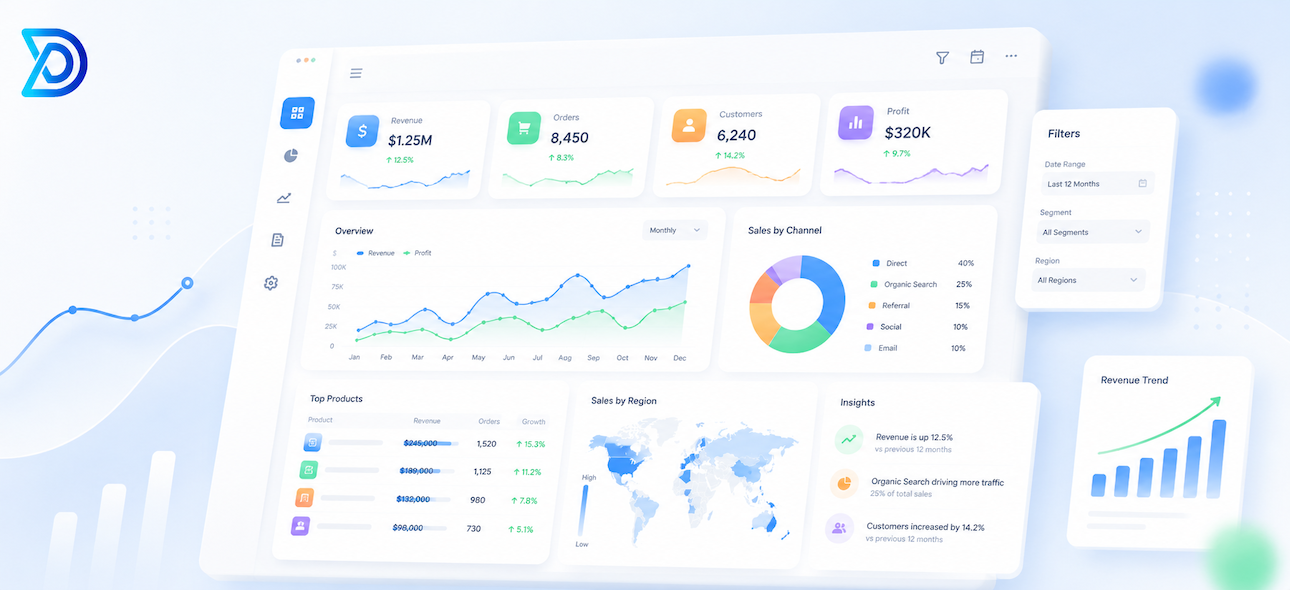
What a good business dashboard should show
A dashboard should show KPIs, status indicators, filters, trends, exceptions and action-oriented summaries. For implementation support, see Dashboard Development Company.
Dashboards for different teams
Leadership may need revenue and performance summaries. Sales may need pipeline visibility. Operations may need status and workload. Support may need response time and ticket patterns. These dashboards often belong inside web applications or custom applications.
When to use a custom dashboard
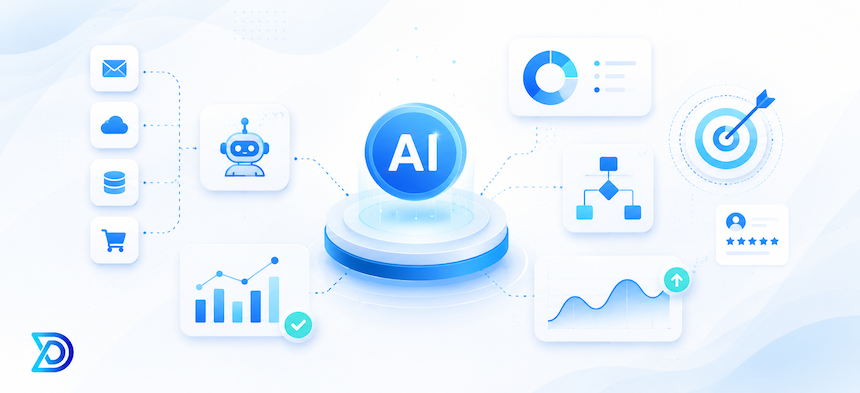
A custom dashboard is useful when data comes from several sources, when users need different permissions, or when reporting is connected to workflows, alerts and follow-up actions. AI summaries from AI Solutions & Automation can also support reporting workflows.
Frequently Asked Questions
Can a dashboard pull data from more than one system?
Yes. Multi-source reporting is one of the strongest reasons to build a custom dashboard layer.
Do dashboards need a separate admin area?
Often yes, especially when teams need role-based access, filters, data controls or content management.
Is a dashboard project standalone or part of a larger platform?
It can be either. Many dashboard projects start as reporting layers and later expand into broader operational systems.
Need better reporting? Request a Custom Project or read custom dashboard development for business reporting.
Need a custom website, app, or AI automation system?
Contact DevDexter to discuss your project and get a practical development plan.