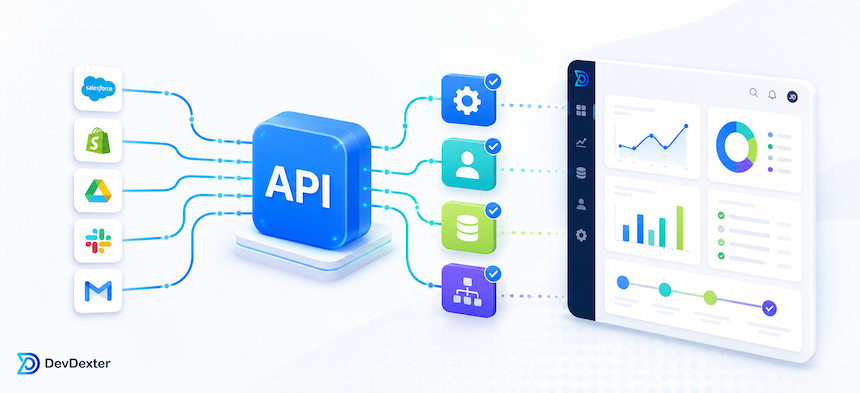




Write down how each key performance indicator is calculated before building a reporting dashboard. When Finance and Sales use different definitions of revenue, a polished chart can make the disagreement harder to spot. A metric specification gives both teams a concrete definition to review.
Define a metric contract before building the dashboard
For each KPI, name its owner, data source, calculation, refresh cadence and access policy. For example, a sales pipeline total should say whether it uses open opportunities only, how multiple currencies are handled and when a delayed import should show a warning. Reconcile a sample day against the source system before rollout.
Test data freshness and access separately
Run a sample refresh with one source unavailable. Keep the last verified numbers visible with the time they were refreshed, and identify the affected metric so an operator can retry the import. Sign in as a regional manager and confirm that filters, drill-downs and exports apply the same access rules as the main report.
Give each chart a decision and an owner
For example, an operations manager who sees overdue jobs needs to know which jobs are late, who owns them and when the underlying list was refreshed. Start with the metrics people use in a recurring meeting and write down what they do when a result is outside the expected range.
For help choosing the first report, see the guide to dashboards by team and decision. If you already know the metrics and sources, discuss dashboard data and requirements with DevDexter.
Need a custom website, app, or AI automation system?
Contact DevDexter to discuss your project and get a practical development plan.